Evaluating Subscription-Based Advisory Platforms Through Quantitative Success Indicators in Competitive Event Forecasting
Written by Mara Koch · Oct 12, 2026
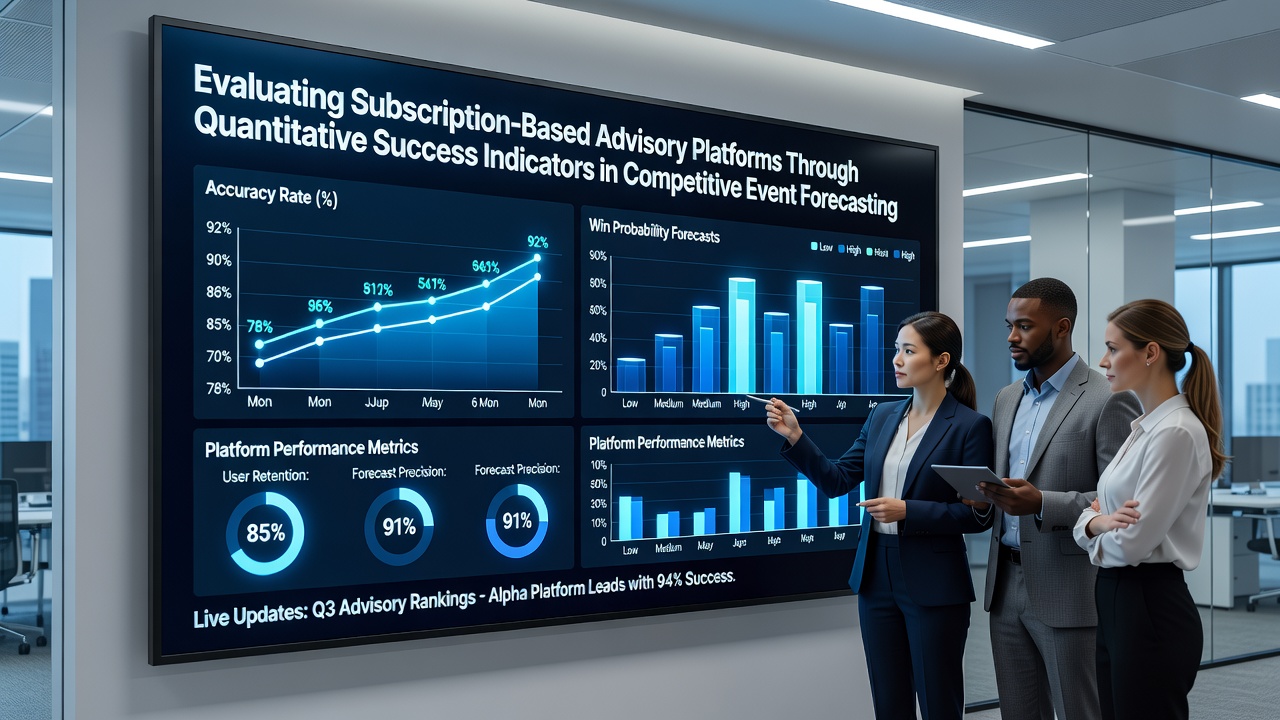
Evaluating Subscription-Based Advisory Platforms Through Quantitative Success Indicators in Competitive Event Forecasting
Subscription-based advisory platforms have expanded their reach into competitive event forecasting, where users access structured predictions for outcomes in sports leagues, financial indices, political contests, and other measurable events, and evaluation of these services relies on quantitative success indicators rather than promotional claims. Researchers track metrics such as hit rates, expected value calculations, calibration scores, and risk-adjusted returns to determine platform performance across large sample sizes of forecasts. Data compiled through October 2026 shows continued growth in platform subscriptions, with industry reports indicating that users increasingly demand transparent performance histories before committing to recurring fees.
Core Quantitative Indicators Used in Platform Assessments
Hit rate serves as a foundational measure, calculated as the percentage of correct forecasts divided by total predictions issued over a defined period, while experts adjust this figure for varying event difficulties and sample volumes to avoid distortion from small datasets. Expected value incorporates both accuracy and odds or probability estimates, yielding a figure that reveals whether following platform advice would generate positive returns after accounting for typical costs or stakes. Calibration examines how closely stated probabilities align with actual outcomes, with well-calibrated platforms producing forecasts where events assigned 70 percent likelihood occur roughly 70 percent of the time across thousands of instances.
Observers note that additional indicators include maximum drawdown, which measures the largest peak-to-trough decline in a simulated or actual return series, and the Sharpe ratio, which compares returns against volatility to highlight consistency. Platforms that publish these figures through independent verification attract more sustained user bases, according to analyses from research institutions tracking advisory services in multiple regions. Those who've examined large-scale datasets find that platforms maintaining public audit trails tend to show steadier performance across seasonal cycles of events.
Data Sources and Verification Methods
Independent third parties collect forecast records directly from platform APIs or user-submitted logs, then apply statistical tests to detect anomalies such as selective reporting or backdating of predictions. In October 2026 several academic groups released updated methodologies that incorporate machine learning cross-validation to test indicator robustness against different event categories. Government agencies in various jurisdictions, including the Federal Trade Commission in the United States, have issued guidance on transparent disclosure of performance data for paid forecasting services, which encourages platforms to maintain verifiable archives rather than summary statistics alone.
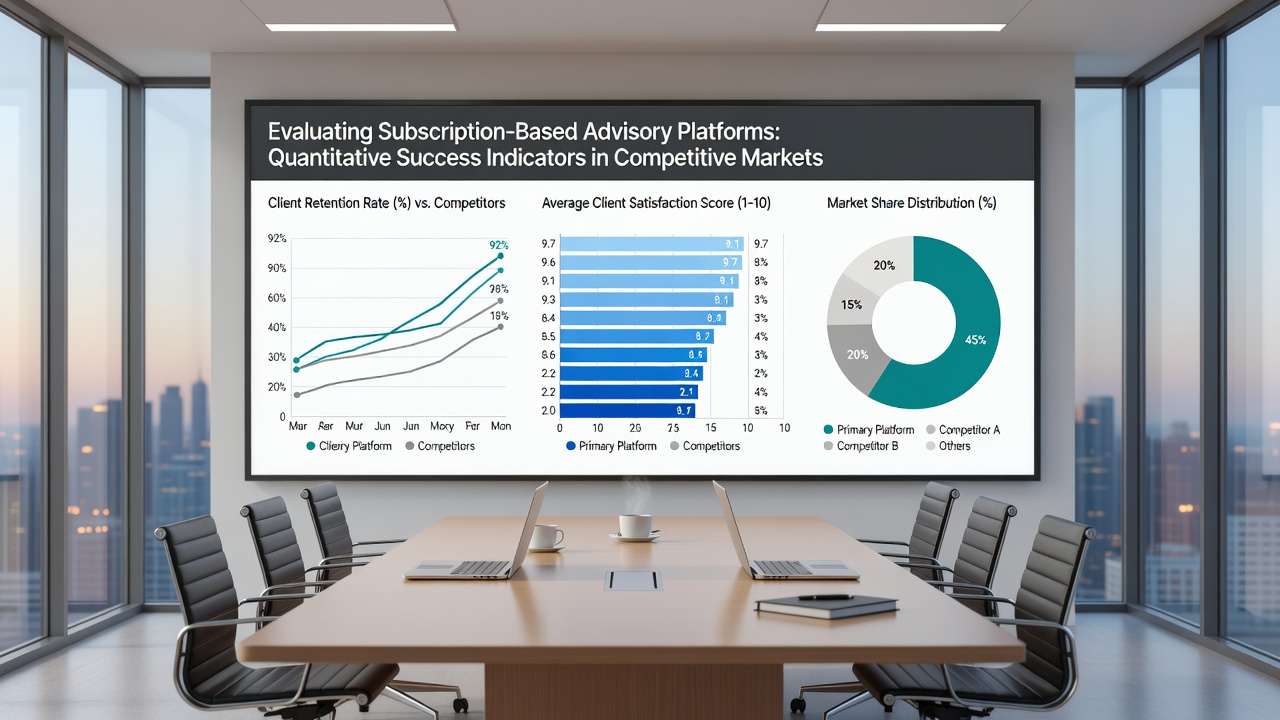
Industry organizations such as the Organisation for Economic Co-operation and Development have published comparative reports on consumer-facing prediction tools, emphasizing the value of standardized metrics that allow cross-platform comparisons. These reports highlight how regional differences in data availability affect evaluation quality, with some markets providing more granular outcome records than others.
Comparative Analysis Across Event Categories
Forecasting platforms often specialize in particular domains, and quantitative evaluations reveal distinct performance patterns when results are segmented by category. Political event predictions, for instance, show higher variance during high-stakes election cycles, whereas financial market forecasts benefit from continuous trading data that permits finer-grained accuracy tracking. Researchers who aggregate platform records across categories find that hybrid services blending multiple event types sometimes achieve better diversification in their success indicators, reducing the impact of any single domain's volatility.
Seasonal factors also influence indicator stability, with certain platforms demonstrating improved calibration during periods of high event frequency. Those who've studied longitudinal data note that platforms releasing monthly or quarterly metric updates enable users to detect trends earlier than annual summaries allow. Evidence from multiple studies indicates that consistent publication of raw forecast files, rather than curated highlights, correlates with more reliable aggregate performance figures.
Challenges in Metric Interpretation
Sample size remains a persistent issue, because platforms with shorter operating histories provide fewer data points for robust statistical inference, which leads evaluators to apply confidence intervals around reported hit rates and expected values. Survivorship bias can distort industry averages when underperforming platforms exit the market without releasing final records. External events such as regulatory changes or shifts in data access policies may also affect forecast quality, requiring analysts to control for these variables when comparing platforms over time.
Platforms that segment their metrics by forecast confidence level or by event liquidity provide additional layers of insight, allowing users to identify strengths in specific subsets of predictions. Observers note that combining multiple indicators into composite scores helps mitigate the limitations of any single measure, although the weighting of those components requires careful justification based on user objectives.
Conclusion
Quantitative evaluation of subscription-based advisory platforms in competitive event forecasting continues to rely on established statistical measures applied to expanding datasets. As platforms release more granular records and independent verification processes mature, users gain clearer pictures of relative performance across different services and event types. Ongoing research and standardized reporting practices support more informed comparisons without reliance on unverified claims.